How to Analyze fastly bandwidth consumption with Newrelic
If you are a Adobe Commerce customer, in general there is no hard limit set on how much fastly Bandwidth can be consumed. But if the bandwidth consumption is unreasonable high Adobe might ask you to look in to it and fix it.
In general the Bandwidth consumption is directly related to the site traffic. But there are instance where the bandwidth consumption is exponentially high even without the relative site traffic.
There could be multiple reasons for that
- Too Many requests from Bots and Monitoring tools
- To many 404 urls
- Non Existing images returning 404 page, In general the image content types should not return 404 if the image doesn't exists
- Bad theme, Generally a Magento PDP size would be around 200kb to 300kb If the size of the page increases this will also result in more bandwidth consumption
- etc..
In this Blog we will see how to use Newrelic to get the insights of Fastly Bandwidth Consumption.
To start with lets first Understand how Fastly would calculate the Bandwidth, This Fastly Page (How we calculate your bill) describes this.
We charge for each response and for the size of the response (which includes the header and body). Each response is billed as a single request, and the response size in bytes is billed as bandwidth. We charge for bandwidth and requests for content delivered to clients from the CDN and for bandwidth for traffic sent from the CDN to our customers' origins.
Let's assume we have a url name http://example.com/iphone12.html which contains the below requests.
| Request No | Request Type | URL | Size | Cached In Browser |
| 1 | HTML (DOC) | Iphone12.html | 200kb | No |
| 2 | CSS | Style1.css | 10kb | No |
| 3 | Style2.css | 10kb | No | |
| 4 | JS | Script1.js | 10kb | No |
| 5 | Script2.js | 10kb | No | |
| 6 | Images | Image1.png | 10kb | No |
| Total | 250KB |
Here, In the First Request of the URL iphone12.html the total bandwidth consumption would be around 250KB (HTML+CSS+JS+IMAGES)
Lets say the user is again refreshing the same page, Now depends upon the cache-control header setting the resource such as CSS,JS,Image may or may not cached in the browser.
| Request No | Request Type | URL | Size | Cached In Browser |
| 1 | HTML (DOC) | Iphone12.html | 200kb | No |
| 2 | CSS | Style1.css | 10kb | Yes |
| 3 | Style2.css | 10kb | Yes | |
| 4 | JS | Script1.js | 10kb | Yes |
| 5 | Script2.js | 10kb | Yes | |
| 6 | Images | Image1.png | 10kb | Yes |
| | | Total | 200KB | |
For our ex lets assume all the css,js,image urls are cached in the browser so the bandwidth consumption would be 200kb.
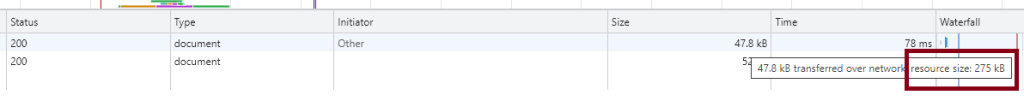
The size of the url content can be seen in the chrome network tool as well, Here the "resource size" will be considered not the size of "transferred over the network". Also you can view source of the page and save it in a file and see the size of the file which will be almost the same.
Now lets see how we can make use of NewRelic Query Language to find out the Bandwidth Consumption
In every HTTP request logs these two parameters are available
- resp_body_size
- Body bytes send to the client in the response.
- resp_header_size
- Header bytes to send to the client in the response.
By summing up these values in the HTTP request we can find out the total bandwidth consumption.
Below are some sample NRQL
To Find out the Total Bandwidth Consumption for a Day
SELECT sum(numeric(resp_body_size)+numeric(resp_header_size)) as Size
FROM Log
WHERE client_ip is NOT NULL
SINCE 1 day ago
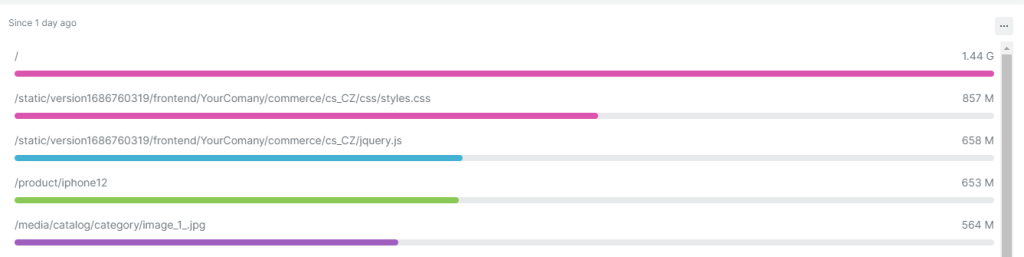
To Find out the which URL is consuming more Bandwidth in a Day
SELECT sum(numeric(resp_body_size)+numeric(resp_header_size)) as Size
FROM Log
WHERE client_ip is NOT NULL
FACET url
SINCE 1 day ago
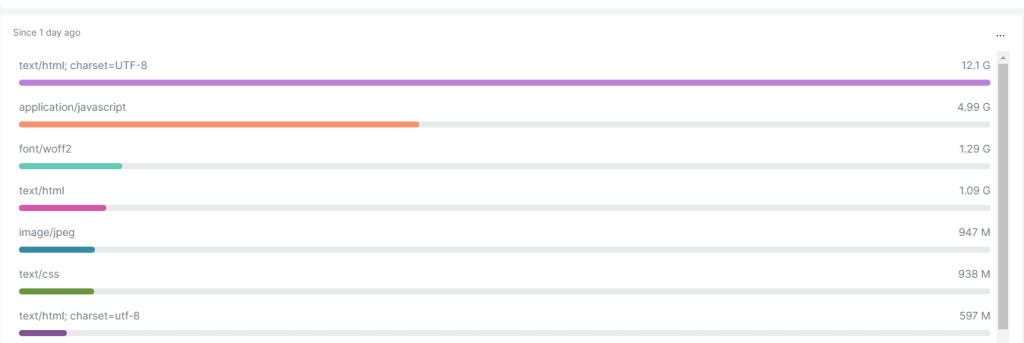
Find which content type is consuming more
SELECT sum(numeric(resp_body_size)+numeric(resp_header_size)) as Size
FROM Log
WHERE client_ip is NOT NULL
FACET content_type
SINCE 1 day ago
To Find the total consumption of Home Page URL for a day
SELECT sum(numeric(resp_body_size)+numeric(resp_header_size)) as Size
FROM Log
WHERE client_ip is NOT NULL
AND url = '/'
SINCE 1 day ago
Remember when we say Home Page URL we are talking about only the HTML content of the home page, To load the home page we will need several css and js files those are not considered here.
To Find out the total Bandwidth Size of the CSS files for the Home Page
SELECT sum(numeric(resp_body_size)+numeric(resp_header_size)) as Size
FROM Log
WHERE
client_ip is NOT NULL
AND content_type LIKE '%text/css%'
AND request_referer = 'https://yourhomepage/'
SINCE 1 day ago
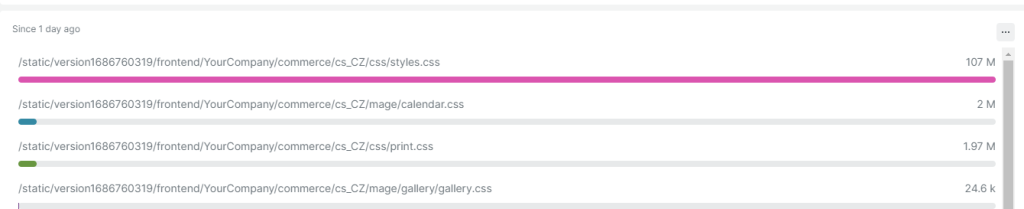
To Find out which CSS file size is more for the Home Page.
SELECT sum(numeric(resp_body_size)+numeric(resp_header_size)) as Size
FROM Log
WHERE client_ip is NOT NULL
AND  content_type LIKE '%text/css%'
AND  request_referer = 'https://yourhomepage/'
FACET url
SINCE 1 day ago